As Ethiopia maps its economic course, a meticulous review of its monetary policies unveils a path defined by strategic maneuvers, adaptability, and a steadfast dedication to ambitious development plans. This analysis spans from the initiation of Growth and Transformation Plans (GTP) to the contemporary Home-Grown Economic Reform Agenda (HGER), offering a comprehensive insight into Ethiopia’s landscape of domestic loans and advances across economic sectors. The aim is to enhance comprehension of how the objectives outlined in the ten-year strategic development plan, extending to 2030, align with and shape this financial trajectory.

The Context
During the initial phase of Ethiopia’s Growth and Transformation Plan (GTP I), spanning from 2010 to 2015, the country’s monetary policy was characterized by a mix of strategies to support the ambitious development goals outlined in the plan. Key features of the monetary policy during this period included:
Credit Controls and Directed Lending
The National Bank of Ethiopia (NBE) employed credit controls to direct funds towards priority sectors, such as infrastructure, agriculture, and industry. A credit cap that restricted lending was in place for three years on banks before it was ended in 2011, and NBE instructed all commercial banks to buy 27pc of their annual loan disbursement in bonds in tandem with its removal of the cap.
Implemented lending initiatives were strategically directed to allocate financial resources to key sectors essential for achieving the plan’s objectives. As evidenced by the policy bank – Development Bank of Ethiopia in its end-of-2016 budget year report, the bank actively participated in GTP-II by formulating plans for loan approval, disbursement, and collection, amounting to Birr 112.28 billion, Birr 104.34 billion, and Birr 39.15 billion, respectively, at the end of the fifth year. This reflects the bank’s alignment with the country’s GTP-I experience and the government’s overarching direction.
Interest Rate and Liquidity Management
NBE strategically employed a multifaceted approach to foster investment in priority sectors while upholding overall economic stability. Through a range of monetary tools, the NBE meticulously balanced the quest for accessible credit with the imperative of averting inflationary pressures. Noteworthy measures included open market operations, where the NBE tactically engaged in T-bill purchases to fine-tune the money supply. This intricate strategy aimed to manage liquidity in the banking system, curbing inflation and ensuring a stable financial environment.
Additionally, the central bank utilized reserve requirements, stipulating the percentage of deposits that commercial banks must maintain as reserves to regulate the overall lending capacity of banks. Furthermore, the NBE adjusted the interest rate at which commercial banks could borrow from the central bank, thereby influencing banks’ borrowing costs and impacting lending rates throughout the economy. For instance, back in September 2021, the NBE raised the interest rate levied on commercial banks on loans from the central bank by 13% percentage points to 16%. The second phase, encompassing GTP II and the first Home-Grown Economic Reform Agenda (HGER I), unfolded from 2015 to 2021, witnessing adjustments in Ethiopia’s monetary policy to align with evolving economic priorities. Key elements of the monetary policy in this extended period, especially in the HGER, include:
Liberalization Efforts
A shift towards a more market-oriented approach was observed, with efforts to liberalize selected sectors of the economy, including Finance and Telecom. The opening up of sectors aimed to attract foreign investment, enhance competition, and foster private sector development.
Inflation Targeting
NBE has strategically shifted its focus towards inflation targeting as a primary objective, emphasizing the preservation of price stability in the economy. Recently, at a hearing in Parliament, the NBE set a 20% inflation target for the end of the Ethiopian fiscal year 2016 (2023/24), promising a significant drop from the previous year’s 33.7% baseline inflation rate.
To achieve this, interest rates and monetary tools have been strategically deployed to manage inflation within a specified target range, aligning with the goals set in the HGER I.
The specific measures include:
- Gradual reduction of direct budgetary advances (slowly decreasing the amount of money the government borrows directly from the central bank to conduct operations or undertake capital projects.)
- Control of the growth of reserve money (managing the amount of money banks keep in their reserves. This is done to ensure financial stability and prevent too much money from being in circulation, which could lead to inflation. It’s like putting a limit on how much water can flow from a tap to prevent flooding.)
- Potential Introduction of market-based monetary policies and instruments. (like term deposits and certificates of deposits (CDs), allowing better money management. With the introduction of capital markets, CDs could be traded among investors in a secondary market, increasing liquidity and efficiency in the financial system.)
Transitioning towards a price-based monetary policy signifies a notable shift in how NBE manages the economy’s monetary dynamics. Moving away from direct control over the money supply, the focus now pivots towards adjustments in interest rates. However, a potential challenge emerges if the injection of money, facilitated by instruments like CDs over an extended period, accelerates. This rapid influx may pose difficulties for the bank in maintaining effective interest rate controls, impacting factors such as inflation, unemployment, and overall economic growth during this transitional phase. While the new approach enhances short-term control, ensuring seamless transition management is crucial to pre-empt potential challenges and ensure sustained success.
Credit Expansion Control
The NBE has allowed for a credit expansion, permitting a growth rate of up to 14% by 2023. This decision can be likened to adjusting the speed of a bicycle, where the economy serves as the bicycle, and the monetary policy lever operates as the gear shift controlling its speed. Much like a bicycle accelerating too quickly, leading to potential accidents, an economy growing too fast can result in economic imbalances or instability. The NBE, acting as a prudent driver, seeks to avoid such risks by permitting a controlled credit expansion. This approach serves as a metaphorical allowance on the gas pedal, regulating the amount of money circulating in the economy. The aim is to strike a balance—allowing enough money for economic growth while preventing an excessive surge in prices.
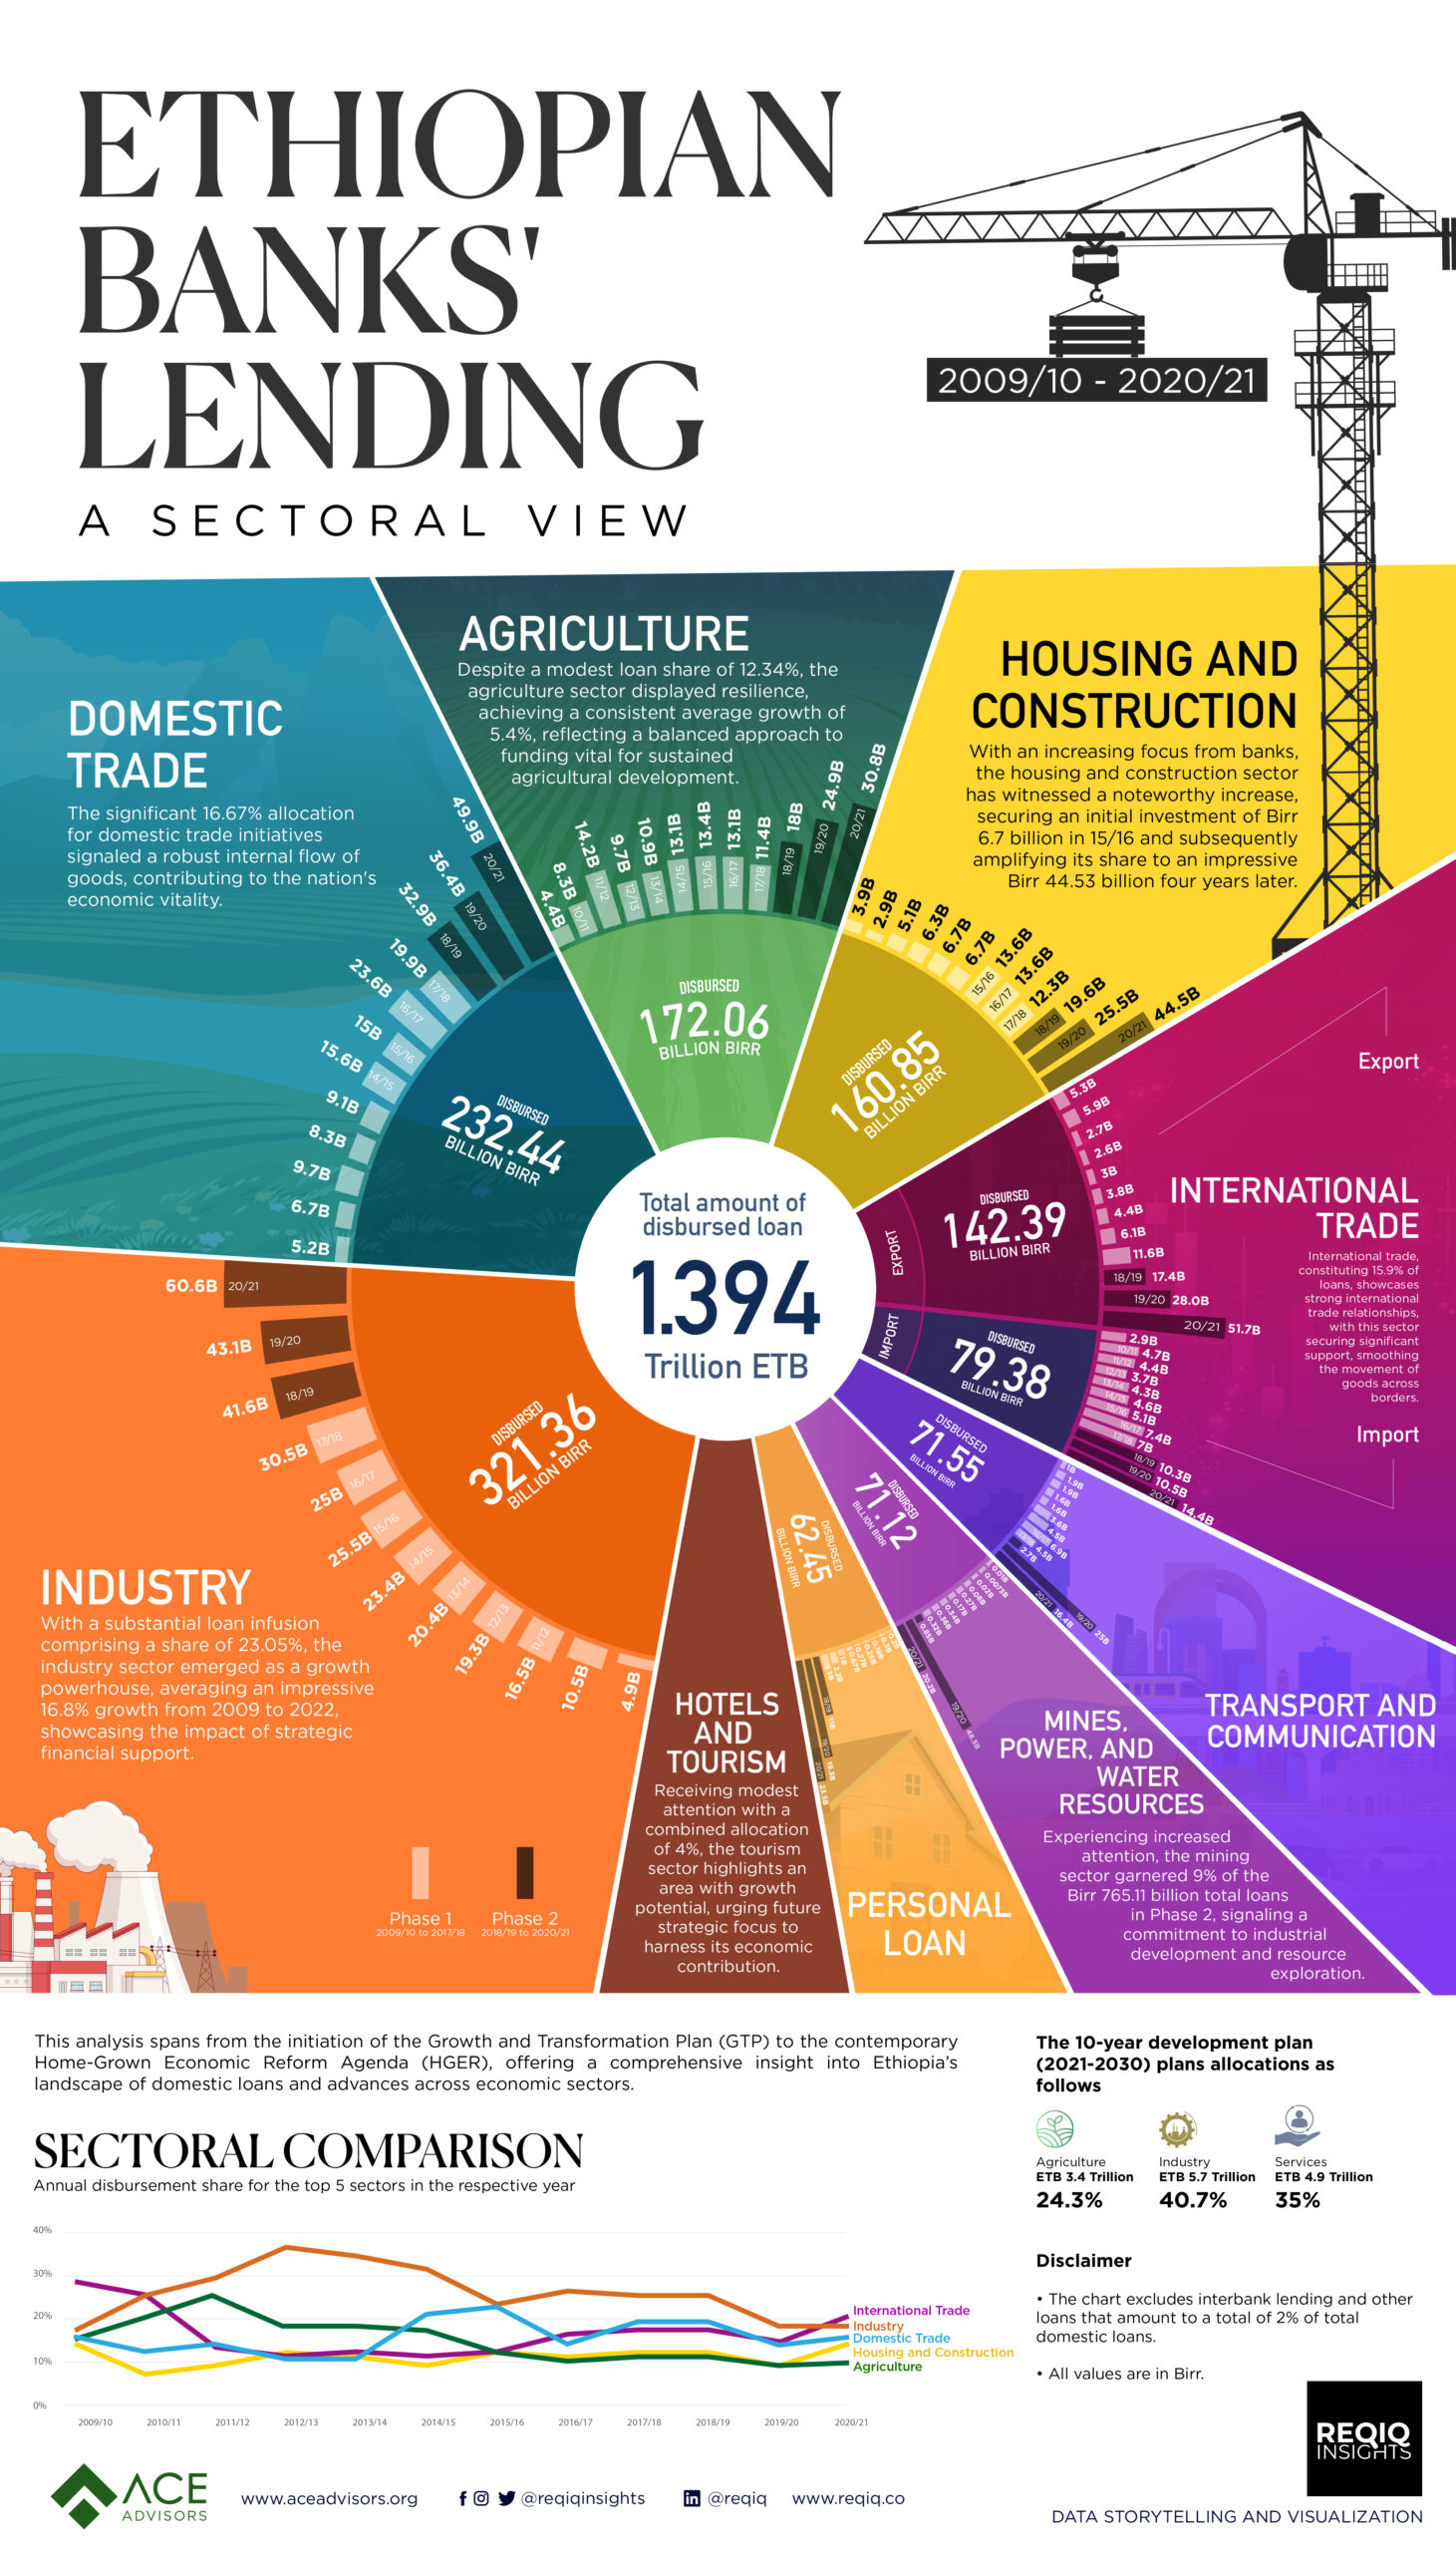
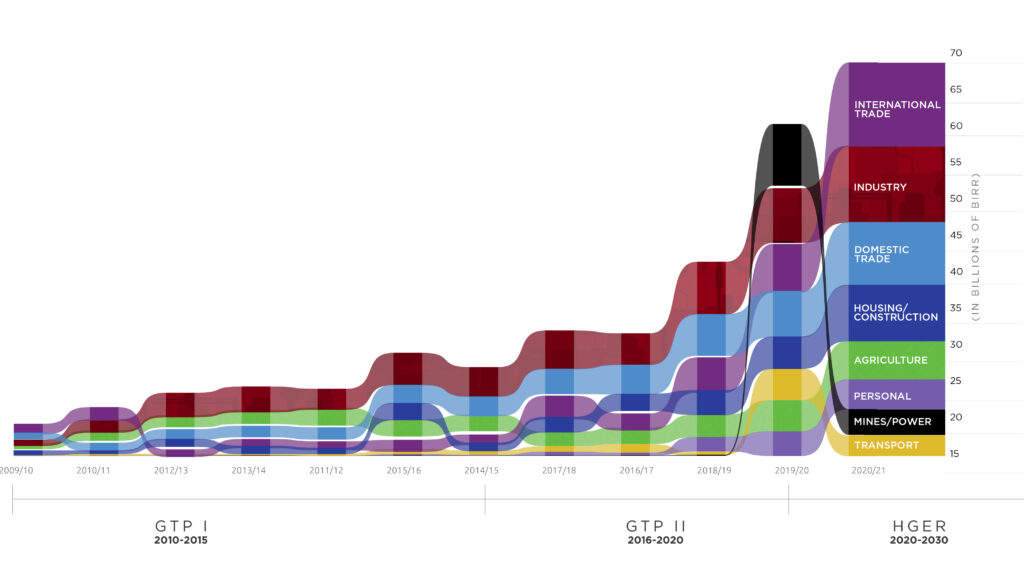
Transitioning to the subsequent segment, let’s examine a pivotal aspect: the trends in Total Loans Disbursed. This section provides a strategic perspective on the allocation of funds within the economy. Encompassing Phase 1 spanning from 2009/10 to 2017/18, and Phase 2 from 2018/19 to 2020/21, we will scrutinize the distribution of loans and discern the sectors receiving prioritized attention.
Total Loans Disbursed: A Strategic Pulse
Phase 1: 2009/10 – 2017/18
The substantial disbursement of Birr 629.35 billion signifies a significant financial allocation strategically directed towards pivotal sectors. Noteworthy is the prioritization of industry, commanding a substantial 28 percent, highlighting a clear emphasis on fostering economic diversification and growth. Agriculture remains a central focus with a 16 percent allocation, while housing and construction receive 11 percent. However, sectors such as Tourism and Mining are allocated a modest 2 percent and minimal attention, respectively.

Insights
During the GTP I, Ethiopia achieved remarkable economic growth, averaging 10.1 percent against the planned 11.2 percent. The country’s output, measured by Gross Domestic Product (GDP), soared from USD 30 billion in 2009/10 to USD 55 billion in 2013/14, representing an impressive 83 percent increase in just four years.
Employment
The broad-based economic growth, especially in agriculture, service, and industry sectors, created a substantial number of jobs. The service sector, in particular, experienced annual growth rates between 9.9 and 12.2 percent during the first four years of GTP I.
Inflation
Sustainable and stable economic growth during the GTP I period contributed to relatively low inflation rates. Ethiopia’s economic growth irregularity was lower compared to many African countries, maintaining above ten percent growth, except for a dip to 8.6 percent in 2012.
Pro-poor Growth
In alignment with pro-poor spending initiatives, the government significantly increased spending on poverty reduction, leading to tangible improvements in the Human Development Index (HDI). Ethiopia experienced the fastest human development growth globally, with a 3.35 percent annual growth rate in the HDI between 2000 and 2013.
While achieving rapid and sustainable growth, Ethiopia faced challenges in structural transformation. The share of the industrial sector, particularly manufacturing, in the GDP did not meet the planned targets even though it enjoyed high priority both in policy and disbursement. The economy’s dominance by the service sector, mainly trade, indicated a slow structural shift.
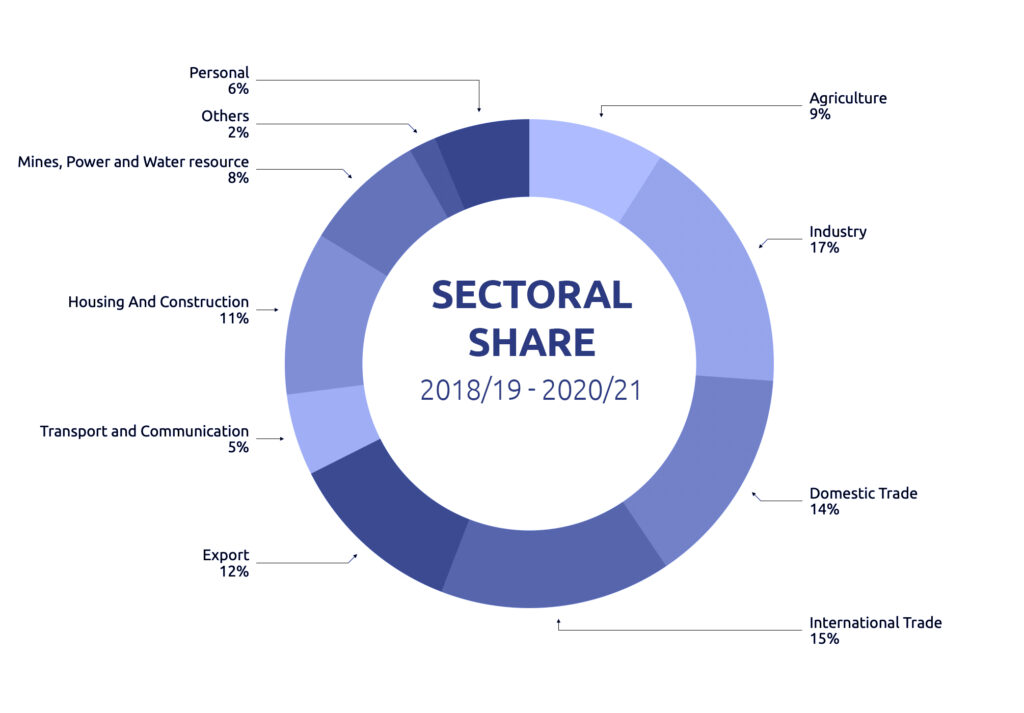
Phase 2: 2018/19 – 2020/21
Distributing a colossal sum of Birr 765.11 billion, the disbursement strategy reflects a diversified economic focus. Industry takes the lead with 19 percent, signalling a commitment to robust industrial development. Although Agriculture received only 10 percent, a significant focus shift was witnessed on Mining, which increased from nearly 0 percent share to 9 percent. Meanwhile, allocations for sectors like Tourism and others remained relatively unchanged.
Insights:
Ethiopia’s economic performance from 2018 to 2022 showcased a robust yet challenging landscape. Real GDP exhibited resilience, registering a growth rate of 5.3 percent in 2022, surpassing East Africa’s average. However, inflation surged to 34 percent partly because of the surge in money supply in terms of loans, influenced by internal conflicts, drought, and global events. The fiscal deficit widened to 4.2 percent of GDP in 2022 due to increased defense spending, while the banking sector, dominated by state-owned banks, remained stable with a nonperforming loans ratio of 5.4 percent in 2021. Despite sovereign ratings downgraded to CCC, public debt saw a decline to 50.1 percent of GDP in 2022. Income per capita grew by 2.7 percent, yet the humanitarian support requirements surged to 20 million people.
Comparative Analysis: Total Disbursement Growth
The transition from Phase 1 (2009/10 – 2017/18) to Phase 2 (2018/19 – 2020/21) reflects a notable surge in total disbursements, with an increase of Birr 135.76 billion, marking a substantial percentage change of 21.56%. Despite the eight-year span of Phase 1, Phase 2, encompassing just three years, demonstrated an accelerated average annual growth rate of approximately 7.19%, indicating heightened financial momentum. Noteworthy is the revelation that within the short duration of 2018/19 to 2020/21, the total disbursement of loans and advances constituted a remarkable 23.04% of the entire disbursement made in the extended 2009/10 – 2017/18 period, signaling an unprecedented surge in economic activity.
In examining the outcomes of these loans, the comparative sectoral GDP growth provides insightful patterns. The industry sector, aligning with the trend in sectoral loans, exhibited robust growth, averaging 16.8% from 2009 to 2022. Domestic Trade consistently received support, contributing to the services sector’s average growth of 10.9%. Despite a comparatively lower share in loans, the Agriculture Sector experienced a modest average growth of 5.4%.

Forging Ahead to 2030
As Ethiopia advances into its 10-Year Development Plan, the numbers reveal a grand economic design that allocates loans to the tune of birr 12.2 trillion (87.2%) to meet the investment needs of the private sector while birr 1.8 trillion (12.8%) would cover the finance need of public investment projects. The sectoral breakdown is as follows
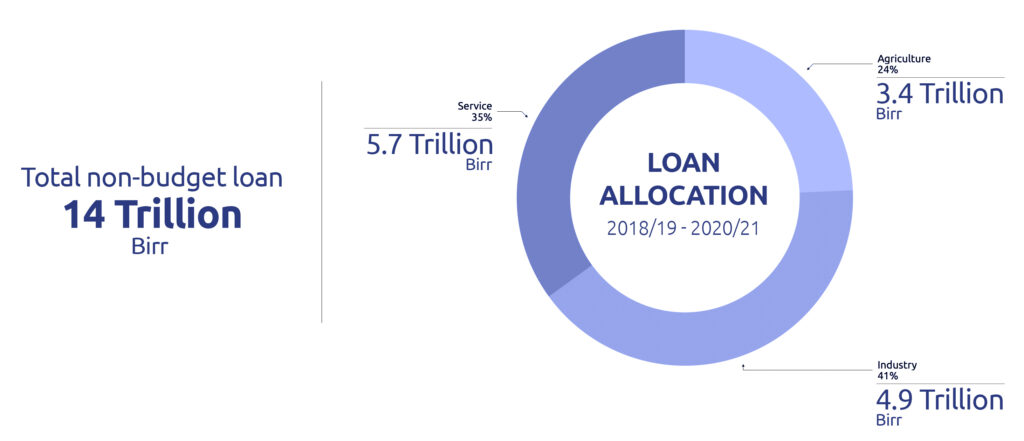
The guiding principles of the ten-year development plan emphasize a shift towards a private-sector-driven economy, allocating a resounding 87.2% for private-sector investment. Diversified financing involving banks, savings, and financial markets underscores a holistic strategy to fund development initiatives. As the plan envisions a transformative period with loans exceeding the trillion ETB milestone, the monetary policy is poised to evolve in the next decade, emphasizing a private-sector-friendly environment. This shift aligns with measures to enhance credit access for businesses, particularly in priority sectors like agriculture, mining, tourism, manufacturing, and ICT.
Further, the plan anticipates increased Foreign Direct Investment (FDI) attraction through continued liberalization efforts, necessitating careful management of capital flows for macroeconomic stability. The central bank’s commitment to inflation control and economic stability is evident, with adjustments in interest rates and other monetary tools, set at 20% for 2023. To enhance resilience to global shocks, the monetary policy framework is expected to draw on lessons from experiences such as the COVID-19 pandemic, while also continuing to play a crucial role in directing funds towards critical infrastructure projects, supporting sustainable economic development.
Conclusion
The outlined transformation in the ten-year development plan lays a robust foundation for a decade-long evolution of monetary policy, emphasizing private sector development and growth in key sectors. To enhance economic stability, it is imperative for the National Bank to effectively deploy monetary tools, address exchange rate challenges, and ensure the prudent disbursement of credit to priority sectors. A dedicated commitment to managing capital flows and controlling inflation, especially within the set target of 20 percent for 2023, is crucial for macroeconomic stability. As Ethiopia progresses toward economic prosperity, the strategic and multifaceted monetary policy framework should be steadfastly implemented to navigate challenges, foster resilience, and achieve sustainable growth.
NBE Annual Reports 2009 – 2021
| Economic Sectors | 2009/10 | 2010/11 | 2011/12 | 2012/13 | 2013/14 | 2014/15 | 2015/16 | 2016/17 | 2017/18 | 2018/19 | 2019/20 | 2020/21 | Totals |
|---|---|---|---|---|---|---|---|---|---|---|---|---|---|
| Agriculture | 4.44 | 8.25 | 14.18 | 9.71 | 10.87 | 13.08 | 13.38 | 13.13 | 11.40 | 17.95 | 24.90 | 30.78 | 172.06 |
| Industry | 4.96 | 10.47 | 16.51 | 19.30 | 20.39 | 23.44 | 25.50 | 25.04 | 30.50 | 41.59 | 43.07 | 60.61 | 321.36 |
| Domestic Trade | 5.17 | 6.73 | 9.70 | 8.33 | 9.10 | 15.59 | 15.04 | 23.61 | 19.94 | 32.87 | 36.40 | 49.96 | 232.44 |
| International Trade (Total) | 8.22 | 10.57 | 7.06 | 5.97 | 7.28 | 8.42 | 9.53 | 13.49 | 18.61 | 27.67 | 38.29 | 66.14 | 221.26 |
| International Trade (Export) | 5.28 | 5.92 | 2.66 | 2.57 | 2.97 | 3.78 | 4.40 | 6.06 | 11.60 | 17.41 | 28.02 | 51.71 | 142.39 |
| International Trade (Import) | 2.94 | 4.65 | 4.40 | 3.70 | 4.31 | 4.63 | 5.12 | 7.43 | 7.00 | 10.26 | 10.49 | 14.44 | 79.38 |
| Hotels and Tourism | 0.32 | 0.3954 | 0.46 | 0.88 | 1.19 | 1.62 | 1.89 | 2.21 | 2.20 | 4.94 | 5.29 | 8.17 | 29.57 |
| Transport and Communication | 0.97 | 1.85 | 1.92 | 1.58 | 1.56 | 3.63 | 4.49 | 6.92 | 4.53 | 2.65 | 25.04 | 16.43 | 71.55 |
| Hosing And Construction | 3.92 | 2.90 | 5.08 | 6.32 | 6.70 | 6.72 | 13.64 | 13.58 | 12.28 | 19.64 | 25.53 | 44.53 | 160.85 |
| Mines, Power and Water resource | 0.01 | 0.0073 | 0.02 | 0.08 | 0.27 | 0.17 | 0.34 | 0.36 | 0.32 | 0.85 | 48.53 | 20.17 | 71.12 |
| Others | 0.34 | 0.7119 | 0.91 | 1.53 | 1.90 | 2.16 | 3.16 | 8.45 | 12.67 | 4.90 | 4.58 | 9.11 | 50.43 |
| Personal | 0.27 | 0.3117 | 0.18 | 0.26 | 0.27 | 0.67 | 1.05 | 2.20 | 2.95 | 11.43 | 19.31 | 23.55 | 62.46 |
| Interbank Lending | 0.30 | 0.01366 | 0.09 | 0.00 | 0.45 | 0.00 | 0.00 | 0.00 | 0.00 | 0.00 | 0.00 | 0.00 | 0.85 |
| Total | 28.91 | 42.21 | 56.10 | 54.25 | 59.97 | 75.48 | 88.02 | 109.01 | 115.40 | 164.49 | 271.17 | 329.45 | 1394.46 |